Visualizations of Quantum Chromodynamics
Centre for the Subatomic Structure of Matter (CSSM)
and
Department of Physics,
University of Adelaide, 5005 Australia
Copyright © 2003, 2004
- This page provides a collection of the most recent visualizations
of Quantum Chromodynamics (QCD), the underlying theory of the
strong interactions. As a key component of the Standard Model of
the Universe, QCD describes the interactions between quarks and
gluons as they compose particles such as the proton or neutron.
State of the art order a4-improved lattice operators
are used in creating the animations, including the three-loop
improved lattice gauge action and the five-loop improved lattice
field strength tensor.
The animaton at right was featured in Prof. Frank Wilczek's 2004
Nobel Prize Lecture.
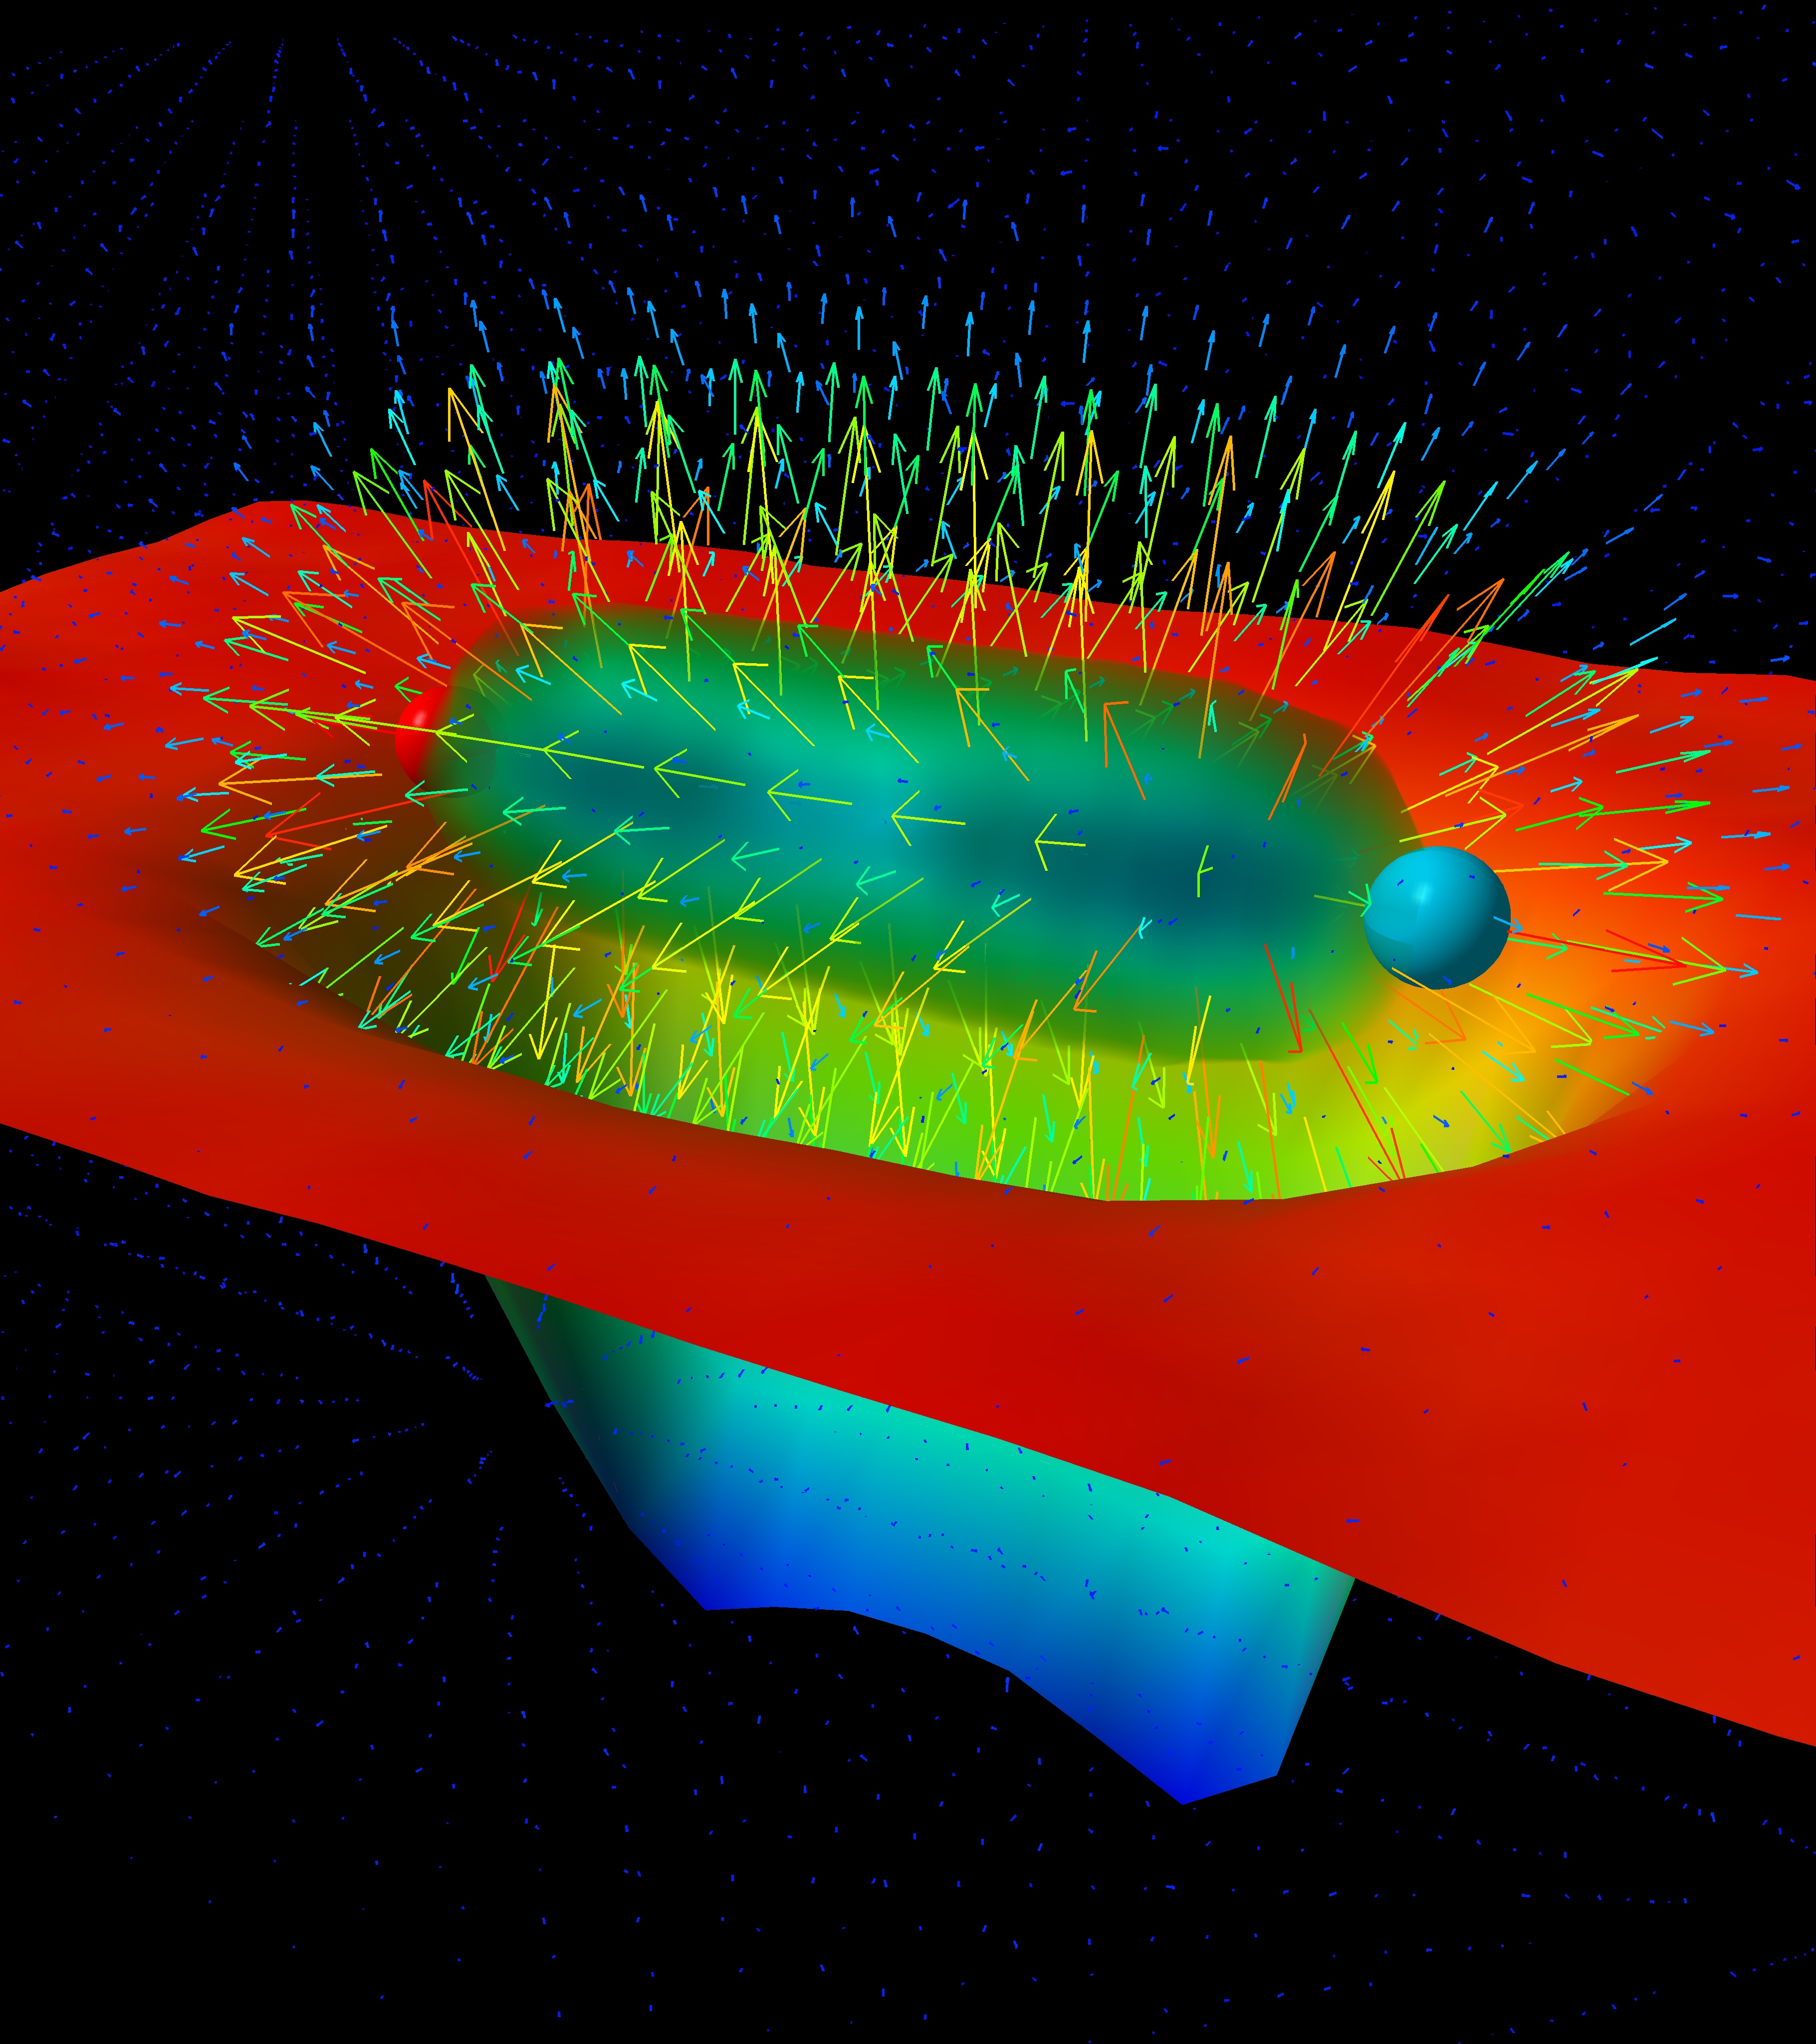
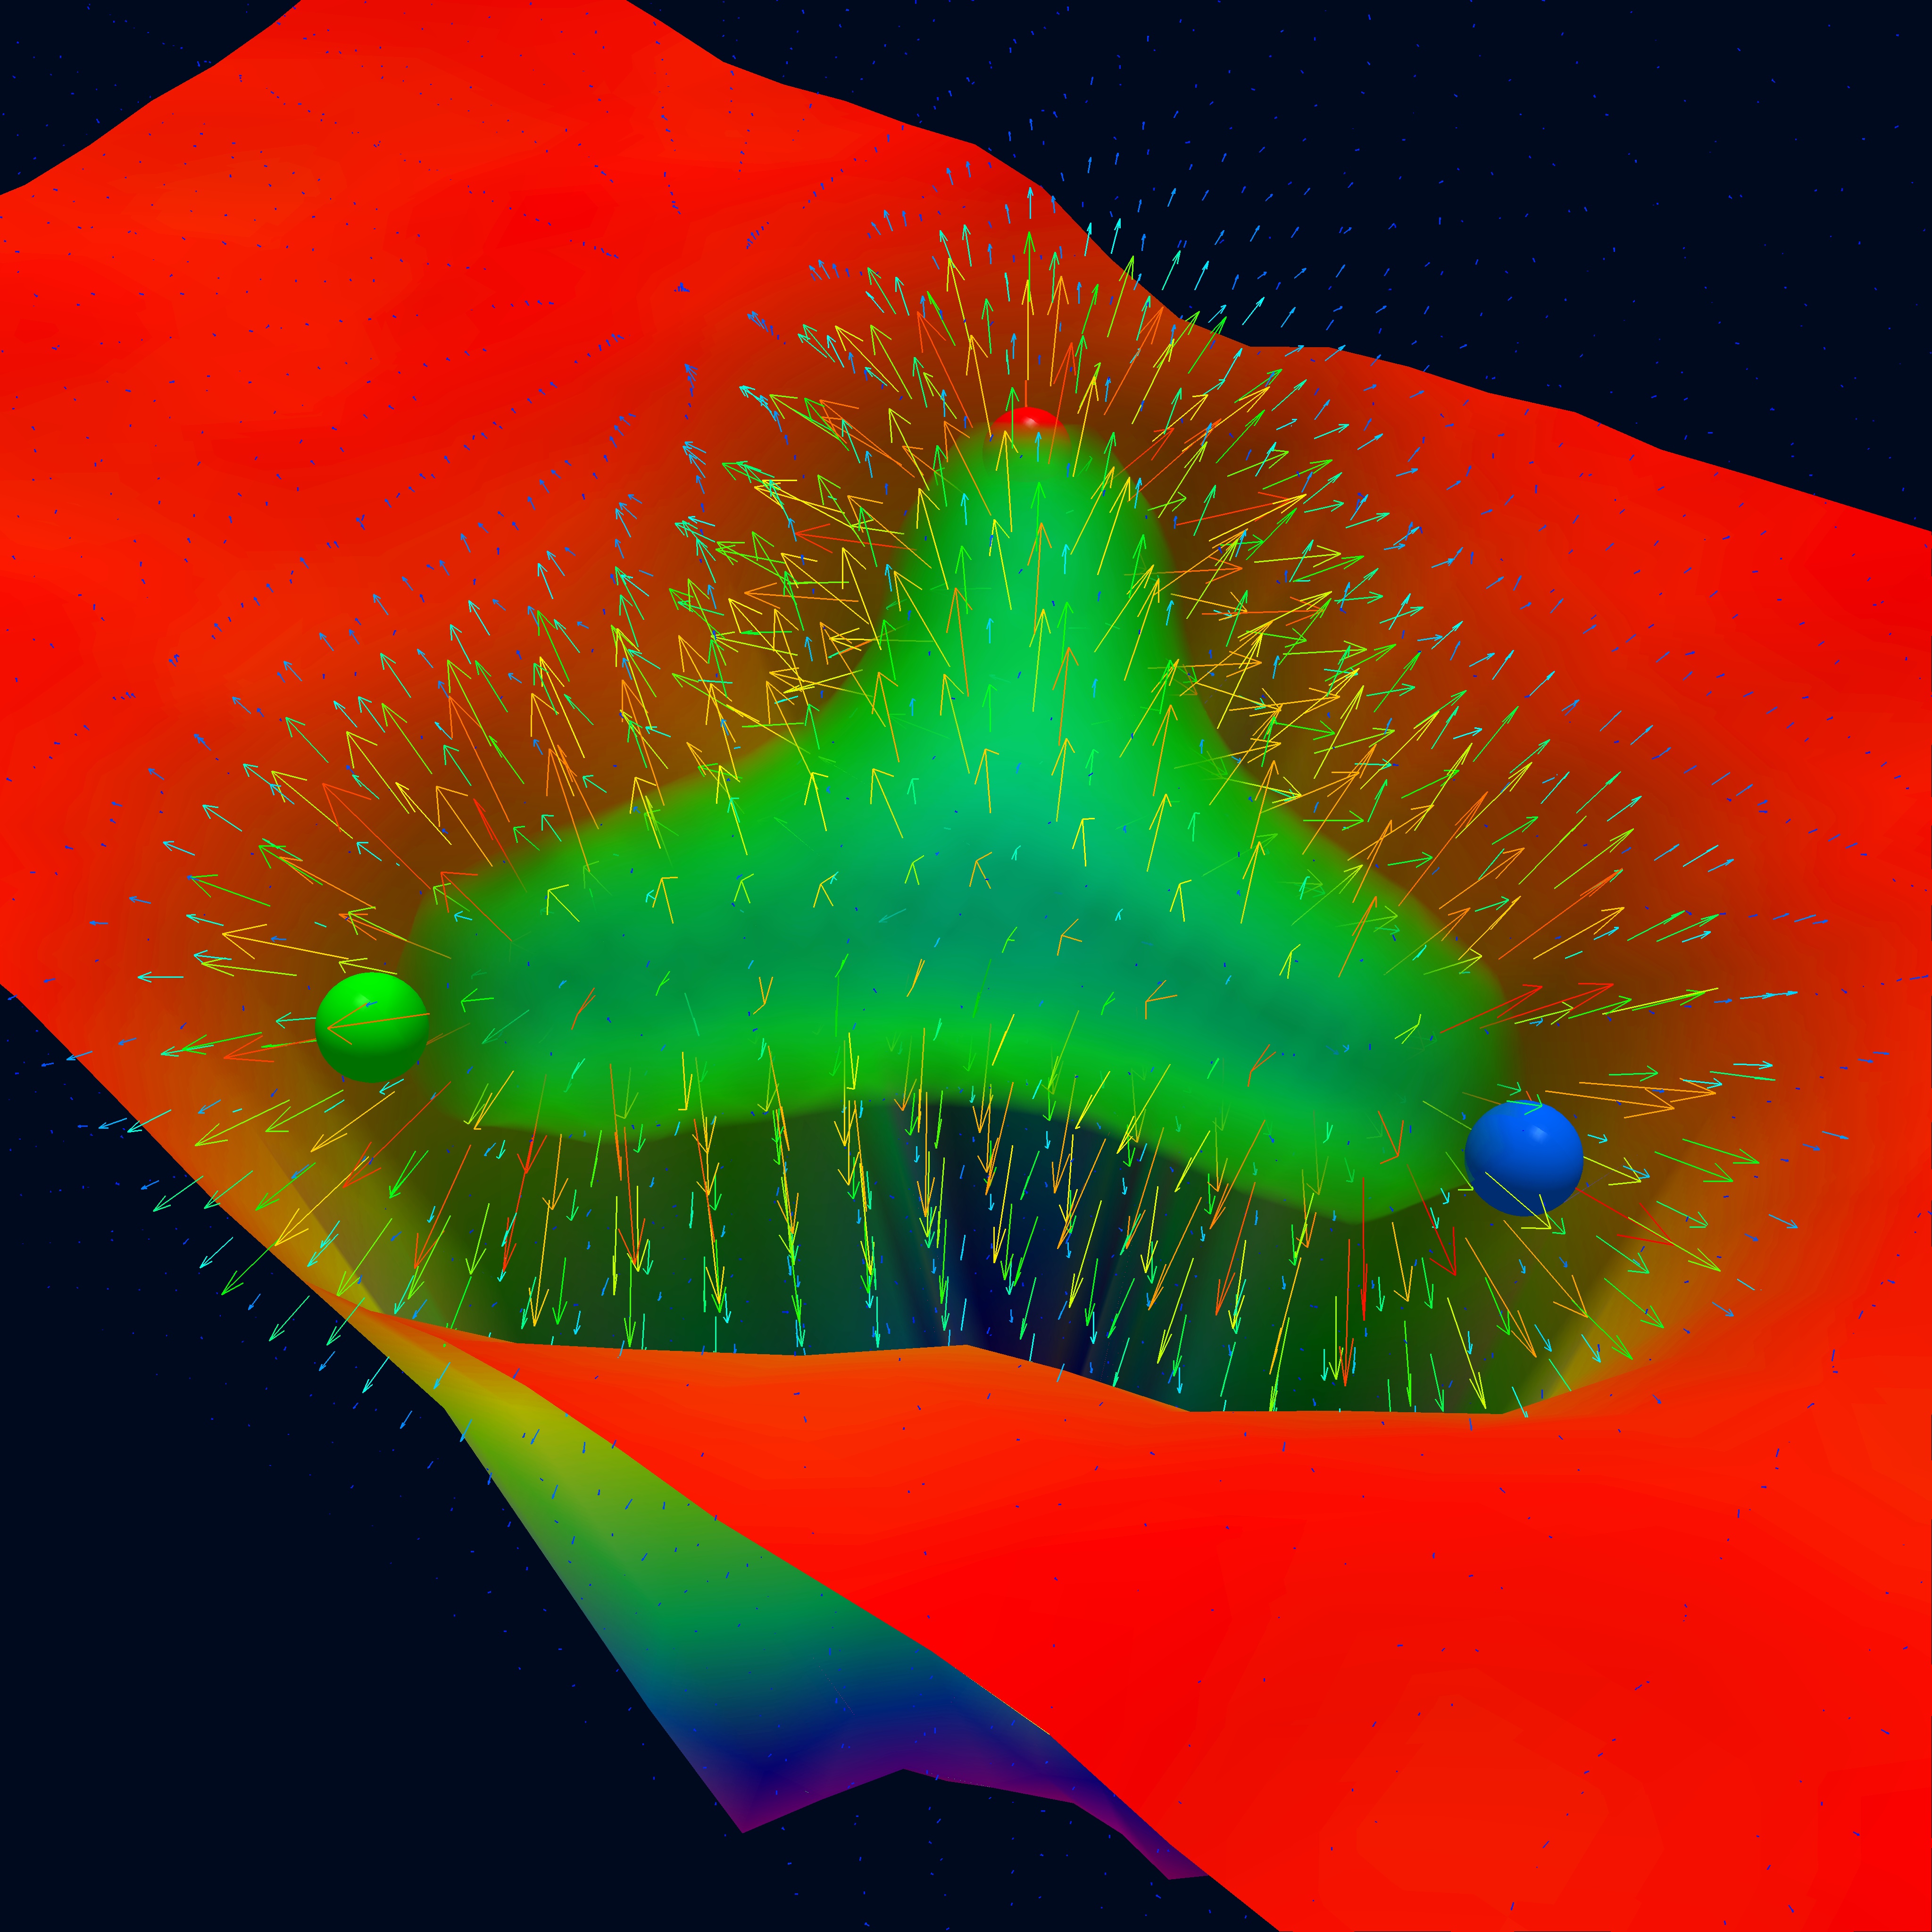
- The manner in which QCD vacuum fluctuations are expelled from the
interior region of a baryon like the proton is animated at right.
The positions of the three quarks composing the proton are
illustrated by the coloured spheres. The surface plot
illustrates the reduction of the vacuum action density in a plane
passing through the centers of the quarks. The vector field
illustrates the gradient of this reduction. The positions in
space where the vacuum action is maximally expelled from the
interior of the proton are also illustrated by the tube-like
structures, exposing the presence of flux tubes. A key point of
interest is the distance at which the flux-tube formation occurs.
The animation indicates that the transition to flux-tube
formation occurs when the distance of the quarks from the centre
of the triangle (< r >) is greater than 0.5 fm. Again, the
diameter of the flux tubes remains approximately constant as the
quarks move to large separations. As it costs energy to expel
the vacuum field fluctuations, a linear confinement potential is
felt between quarks in baryons as well as mesons.
A high quality animation is available:
A high quality picture is also available:
Further details are available in the publicaton
``Gluon flux-tube distribution and linear confinement in baryons''
F. Bissey, F. G. Cao, A. R. Kitson, A. I. Signal,
D. B. Leinweber, B. G. Lasscock and A. G. Williams
Phys. Rev. D 76, 114512 (2007) 16 pp.
[arXiv:hep-lat/0606016]
-
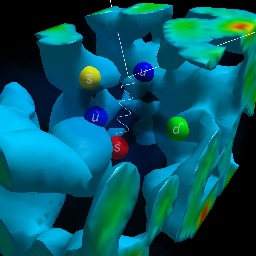
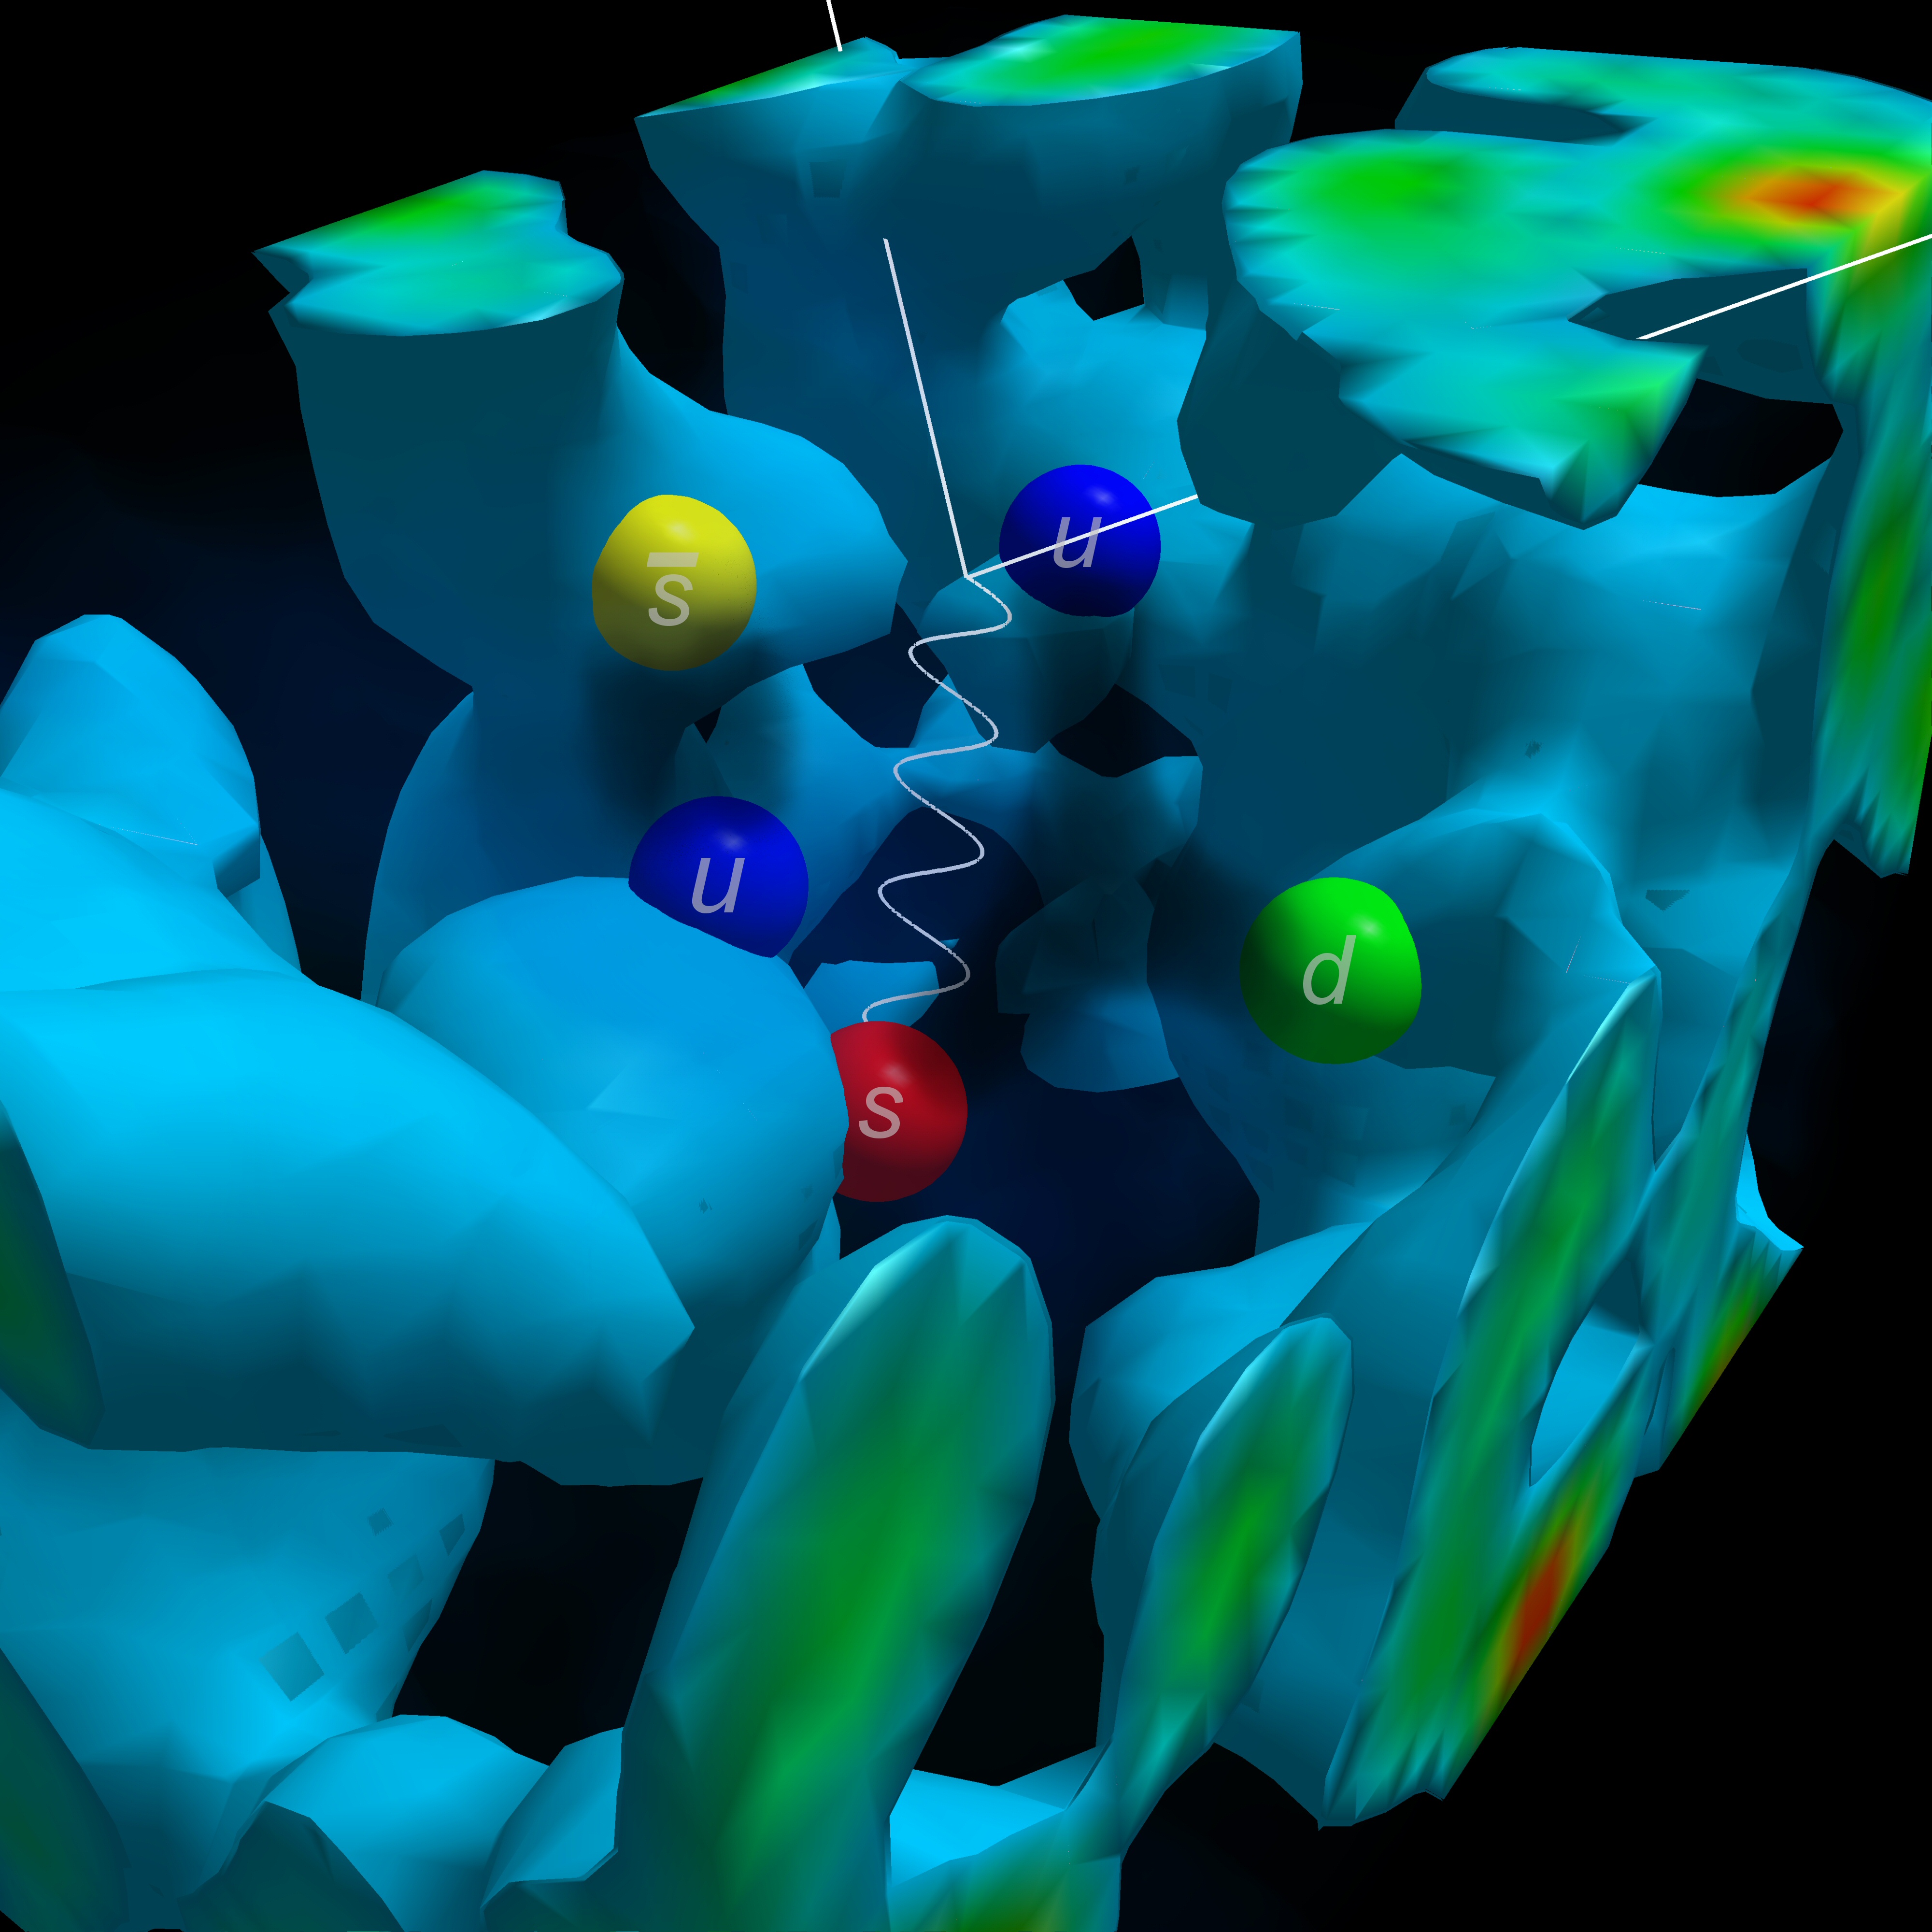
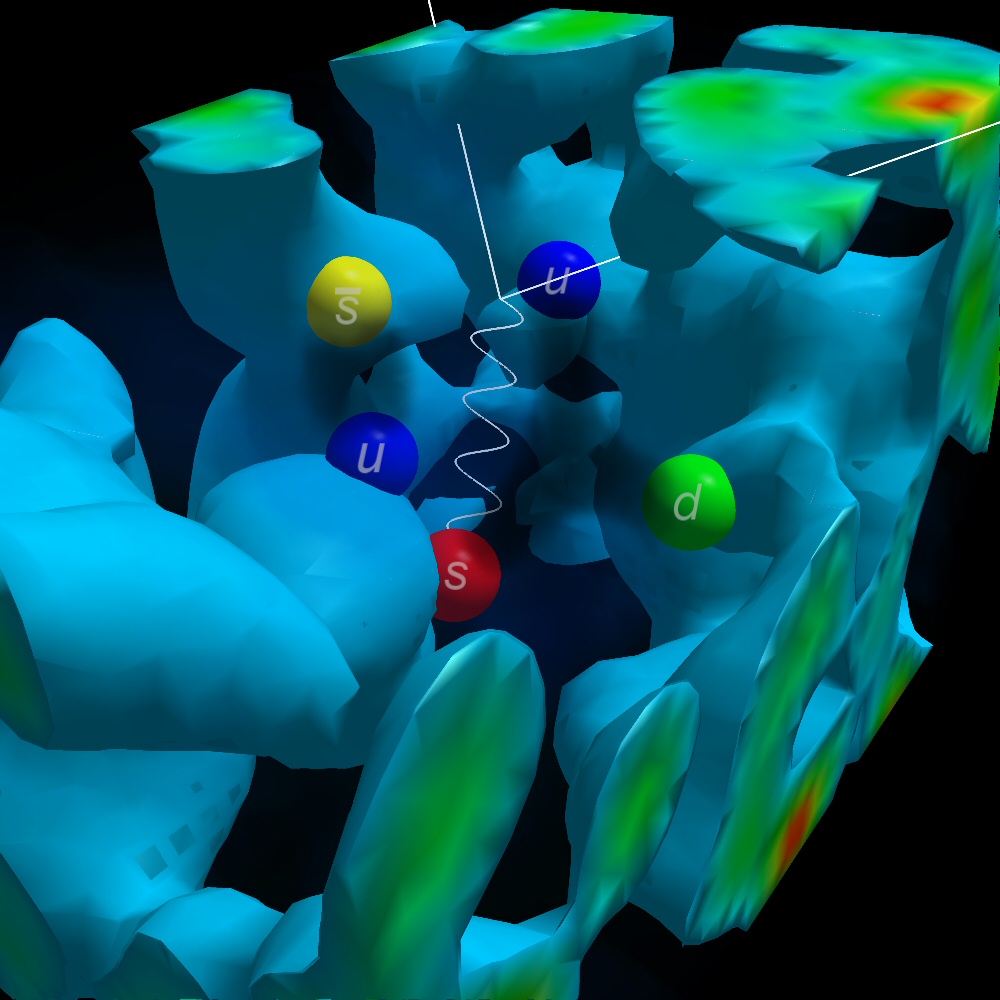
Ponder Strangeness in the Proton
Strange quarks play an important role in the structure of the
proton. This artistic rendition provides a modern interpretation of
the composition of a proton and how expermentalists probe its
structure through electron scattering.
High quality pictures are available:
Contributions from Sundance Bilson-Thompson on improved operator
construction and Ben Lasscock and James Zanotti on the vacuum response
to static quarks, are gratefully acknowledged.
This research is enabled by the NCI National Facility and eResearch SA
through generous grants of supercomputing time. This research is
supported by the Australian Research Council.
For further information, try the web adventure The Origin of Mass,
download the Virtual Reality Up
Close Presentation
or visit the Archives.
For copyright information, please contact
Derek Leinweber.
|

