Nebulae from U.A.O.
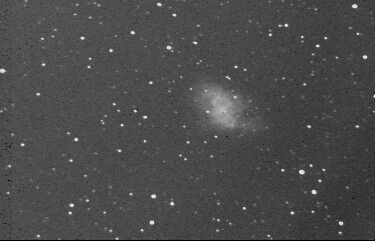
Crab nebula : Three 120-s clear exposures, median-filtered. The target was quite low in altitude at time of exposures, just above a floodlight atop the nearby Chemistry building.
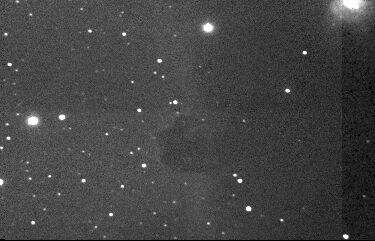
Horsehead nebula : Two 120-s clear exposures, median-filtered.
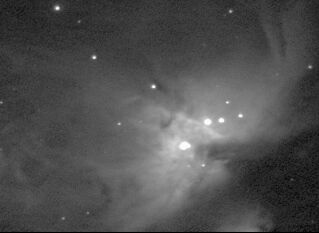
Orion nebula : Ten 60-s U-band exposures, median-filtered, log-scaled.
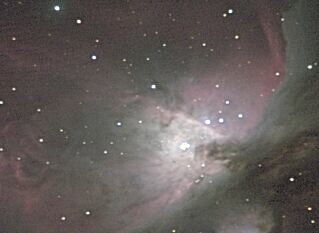
Orion nebula. BVR filters : Individual BVR exposures (several per filter) were combined with a median filter then log-scaled, then composited into a single tri-colour image.
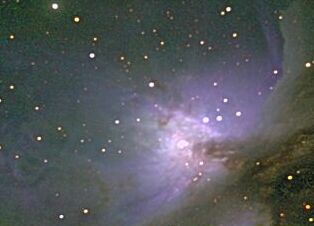
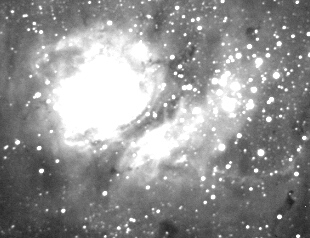
Orion nebula : UVI filters.
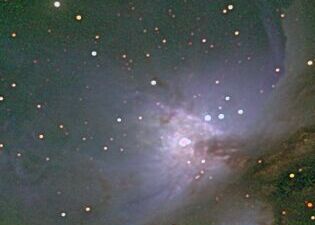
Orion nebula : UBI filters.
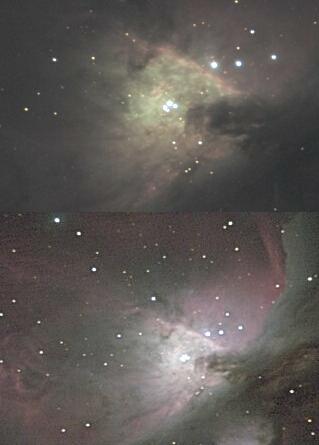
Comparison of Woomera (C14 @ f/7, at top) and A.U.O. (Meade @ f/6.3) BVR images of M42.
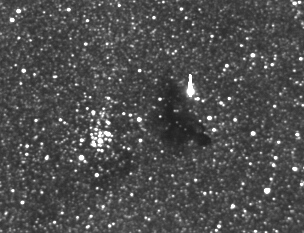
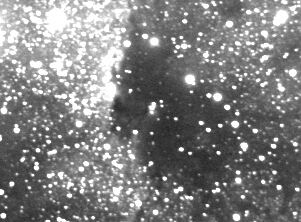
Barnard 86 : 28-29/5/2003, 120-seconds total. This is an absorption nebula, with the open cluster NGC 6520 right next-door.
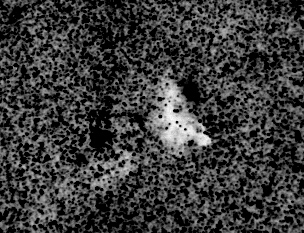
Barnard 86 : same image, just a negative and with intensities scaled to emphasised the dark nebulae. Note the variable opacity B86- much thinner near the edges than in the centre...
NGC 6188 : 28-29/5/2003, 18 minutes total exposure. This is only part of this complex area; both emission and absorption nebulae are involved. Left image is linear-scaled; right is log-scaled.
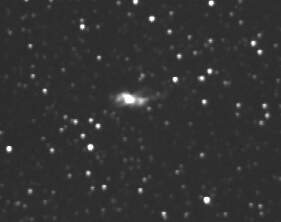
NGC 6302 (Bug Nebula) : 28-29/5/2003, 300-second total exposure. A rather interesting-looking planetary, with only a hint of the detail actually shown here. This is a drizzled exposure, with an enlargement factor of 1.5.
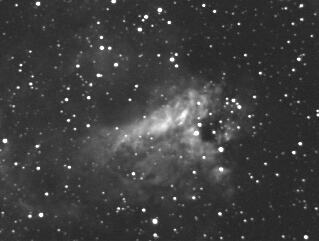
M17 : 28-29/5/2003, 60-second exposure.
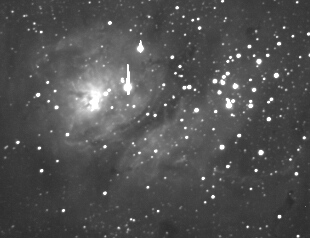
M8 : 28-29/5/2003, 120-seconds total exposure. Left image is scaled to show fainter features; that on the right is scaled to show the brighter features.
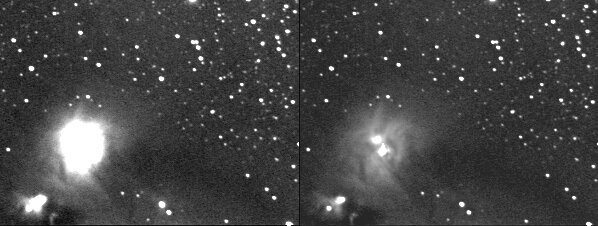
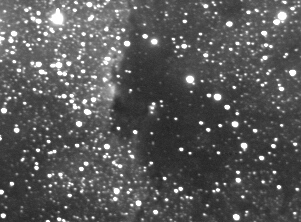
Field of TY & R Corona Australis : 28-29/5/2003, 480-seconds total exposure. Nebular variable stars with reflection and absorption nebulae. Note the difference in the background star density across the field, especially where dust lanes are evident. The right-hand image has been processed using MaxIm DL's Digital Development routine.
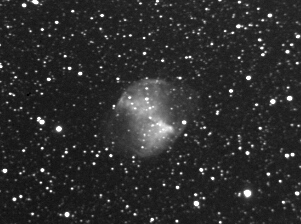
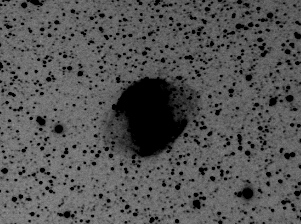
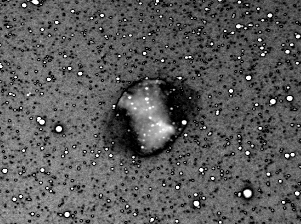
M27 (Dumbell Nebula) : 29-30/5/2003, 240-seconds total exposure. Image on the left is log-scaled. Same in the middle, just inverted and scaled to emphasise the faint "ears". The one on the right shows faint details as negative, with brighter parts as positive- this allows one to see, in a single image, the relationship between the morphology of both the faint and bright sections of the nebula.