Spectroscopy of stars
Spectrum of the cataclysmic variable star AE Aquarii. This spectrum is wavelength-calibrated, but has not been response-corrected. Total exposure time was 20 minutes (10 x 2-minute integrations, median filtered). The spectrum is quite noisy, and of course is still modulated by the instrumental response. However, the H-alpha line is quite clear at l6563. The other usual hydrogen lines may be present, and it is possible- but by no means certain, given the noise- that HeII 4686 is detected.
Reduced spectrum of the Be star d Scorpii. Vertical axis is arbitrary intensity, horizontal axis is in Ångstroms. This is a B star, but showing emission lines of H, rather than absorption lines. It is quite obviously variable, and is currently brighter than it has been for some years.
![]()
Synthesised colour spectrogram based on the above data.
Spectrum of Antares (a Scorpii). Vertical axis is arbitrary intensity, horizontal axis is in Ångstroms. This plot compares the reduced observed spectrum (solid black line) with a model M1 spectrum (green, dashed) from the spectral-type library within VSpec. The best fit from the types available therein was found to be M1; this was without knowing in advance Antares' spectral classification. The published type for this star is, in fact, M1. This illustrates that the equipment and reduction process used is capable of quite good classification of stars of "unkown" spectral type.
There is, however, some disparity between the spectra. It is to be noted that the reduction process, as employed in this example (and for most on these pages) is not absolutely thorough- there is no correction for differing air mass between the calibration and "unkown" stars; the spectrum of the calibration star may not exactly match the model spectrum obtained from the VSpec library; the images were not flat-fielded (although, this should be fairly well accounted for, since all observed stars- including the calibration star- suffer similarly from vignetting. This should essentially be just another factor in the overall instrumental response which is calibrated out during the reduction process). Generally, though, the agreement is good, so one may be confident in applying even such a basic reduction regimen.
![]()
Synthesised colour spectrogram based on the observed and reduced spectrum. Molecular absorption is responsible for many of the dark bands in M-type spectra.
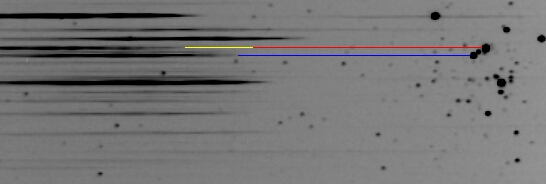
Open cluster NGC 4755 (k Crucis, or Jewel Box cluster). This is a negative reproduction of a cropped and enlarged ST-6 image. The blue line connects a typical cluster star with the beginning of its spectrum. The red line lies between the image of the bright red supergiant star in the cluster, and the position where its spectrum would start if it were in fact a hot, blue star. However, it is a cool, red star, and its spectrum is deficient in the shorter wavelengths; the yellow line shows where the spectrum of this red star actually begins. The unmarked version of this image is shown below.

![]()
The above pair of simulated slit-type spectrograms (based on the spectral image above) compares the spectrum of the red star (upper) with that of the blue star (lower). The zero-order images are aligned on the right; wavelength increases to the left. It is clear that the red star is relatively lacking in short wavelengths, and is relatively brighter at longer wavelengths. Fitting model spectra to the red star's reduced spectrum within VSpec suggests that its spectral type is M2.