Spectroscopy project 2002
Two third-year Physics students, Sarah Crook and Shane Herbig, undertook a project to measure the redshift of the quasar Markarian 509. This object has a redshift of 0.034, and is around 13th-14th magnitude, both of which make it amenable to study with the 8" Meade and the ST-6 CCD.
The Rainbow Optics transmission grating was placed a short distance in front of the CCD chip in order to provide spectra of all objects across the telescope's field of view. Some 25 three-minute exposures (with the Meade tracking, but unguided), were obtained on the night of 11-12/09/2002. On the same night, images of the planetary nebulae M57 and NGC 6572 also were obtained, in order to provide wavelength calibration of the quasar images.
During a night in August, spectra were obtained of M57 and a number of naked-eye stars of various spectral types, from B through to N, in order to provide wavelength calibration, to determine the instrumental spectral response, and to get a feel for the quality of the spectra that could be obtained.
Valerie Desnoux' freeware VSpec was used to perform the wavelength calibrations and response corrections on the data. Christian Buil's freeware IRIS was used to process the original images into a format suitable for study with VSpec.
Data analysis yielded a dispersion of 58.1 nm/pixel, and a redshift of 0.03 for the quasar.
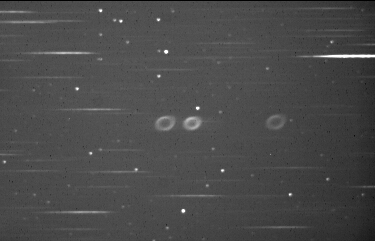
Full field of M57. Zero-order image is to the right.
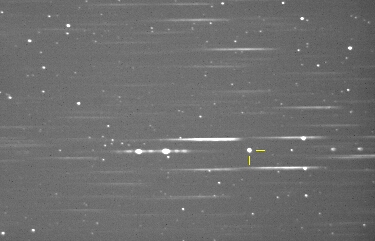
Full field of NGC 6572 (between tic marks; its spectrum is to the left).
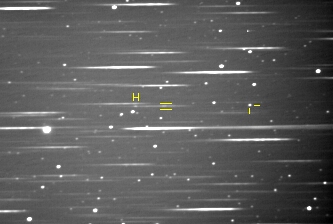
Slightly cropped field of Markarian 509. The quasar's image is between the tic marks, and its spectrum is to the left, between the horizontal bars. The H-alpha emission line is visible as a brightening in the spectrum, below the letter "H".
![]()
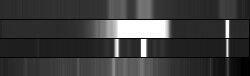
A drizzled (with an enlargement factor of 4) view of the quasar spectrum (the lower spectrum; the quasar is the lower of the two objects to the right of the image). The H-alpha line is visible towards the left end of the quasar spectrum.
![]()
As above, but displayed with a false-colour palette.
Spectral images (produced in IRIS). In all cases, the zero-order image is to the right of the spectral image, and these have been aligned with eachother. From top-to-bottom, we have M57 / Tau Scorpii (B0V type star) / NGC 6572 / Mrk 509. The left-most bright line in the NGC 6572 spectrum is the nitrogen and hydrogen-alpha blend; the slight shift of the H-alpha line in the quasar spectrum is quite clear.
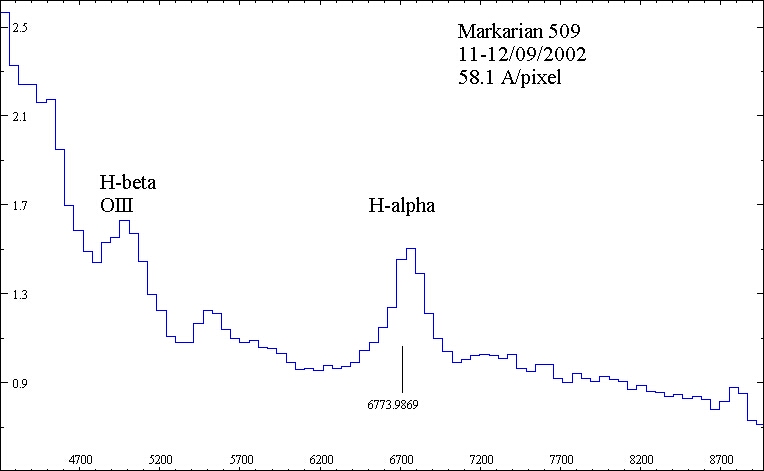
Wavelength-calibrated and response-corrected spectrum of Mrk 509. The spectrum is not flux-calibrated; it has just been corrected for the instrumental response of the equipment, so the vertical scale is arbitrary. The horizontal scale (wavelength) is in Angstroms. The spectrum is presented as a histogram plot in order to emphasise the fairly small dispersion used for this experiment.
VSpec was used to determined the barycentre of the H-alpha line (as marked in the above figure). The calculated redshift is 0.033, very close to the accepted value. However, the barycentre that is determined depends somewhat on the limits that the user places around the line when using VSpec for this calculation, so another attempt at this would yield a slightly different value for z.
Also, it must be noted that since the wavelength calibration depends on the co-alignment of the zero-order images of the spectra of the various objects (planetary nebula and the quasar), there could easily be an error of +-1 pixel in the location of any feature in the spectrum. This corresponds to an uncertainty in wavelength of around +-58 A for any feature, quite apart from that involved in determining the barycentre of a spectral line.
We may therefore estimate upper and lower limits of 0.041 and 0.023 to the value of z determined from these data.
A higher dipsersion (with the grating further away from the CCD) would help to reduce the error, at the expense of an increase in total exposure time required.
It is to be noted that flat-field corrections were not applied to the data images. This will lead to some error in the shape of the spectra extracted from the non-corrected images. However, since the zero-order images of all objects were placed at approximately the same position on the CCD, each will be affected roughly equally by vignetting, and so the effect of vignetting on the final, instrument-response-corrected spectral profiles, will be reduced.
This is not an acceptable approach if we wished to make an accurate measure of the shape of the quasar spectrum. We were, however, concerned with measuring the redshift of the quasar, and this is a measurement which, in this case, is not seriously troubled by not incorporating the flat-field correction.