Photometry of Librae 3
At the time of writing, the classification of this star is uncertain, though it is suspected of being a UX UMa-type CV. It was the subject of a CBA call for observations in May 2003. Co-ordinates are 14:50:39 -24:22:50 (2000.0).
The 0.2-metre LX200 and ST-6 were used for time-series photometry on 29-30/5 and 30-31/5/2003 (i.e. JD 2,452,789 to 2,452,790). Exposures were 80-seconds, unfiltered, and the runs were 5.25 and 6 hours on the respective nights.
Plots of the time-series data data (vertical axis is differential magnitude, horizontal is time in minutes). Errors have been estimated based on the standard deviations of the time-series for 23 field stars.
Plot of the scatters of 23 field stars (crosses), and of the time-series for Lib 3 (filled circles). Vertical axis is scatter (i.e. standard deviation of a time series), horizontal axis is the average differential magnitude for that time series. This plot shows that, at first examination, Lib 3 is not variable above the level of errors in the data, since the scatter in its light-curves is not significantly above that expected for constant stars of the same magnitude.
However, a look at the plot of the light-curves suggests that there may be some coherent trends in the Lib 3 data, although the level of the possible modulation is not significantly above the level of the errors in the data. It is the fact that some of the data show possible non-random trends that is important.
The period-searching routine Lancelot (from the VSNET web-site) was used to perform a search for periods in the range 10 minutes to 6 hours. One of the peaks in its output was consistent with the possible periodic trend visible especially on 29-30/5/2003 from around 200 minutes to 300 minutes, the suggested period being around 60 minutes. Lancelot returned a local peak at 3442 seconds, or 57.3 minutes.
All the Lib 3 data were phased at this period, with the time of the first observation being taken as an arbitrary phase zero. The phased data were then binned with a width of 0.1 in phase, the average magnitude and scatter in magnitude being calculated for each phase bin. The plot below shows the result, i.e. with the data phased at a period of 3442 seconds.
Vertical axis is differential magnitude, and horizontal axis is phase; the data have been repeated for phase 1.0 to 2.0 to aid in the visibility of the trend. The time-series data are shown, with their error bars, as open grey circles. The filled white circles are these data after binning, with the y-error bar giving the scatter within each bin, and the x-error bar showing the bin width.
There is a subtle, but definite, sinusoidal trend to the data. Its amplitude, as taken from the binned points, is only 0.07 mags, which is comparable to the expected scatter for a constant star of this magnitude. However, the non-random trend in these data suggest that there may be a real period here, although the amplitude is very small- and within the error bars. Another night's data, covering a similar time span, would be very useful here.
It is not suggested that this period (if real...) necessarily is the orbital period of this star; indeed, if the modulation here represents the ellipsoidal modulation present in many CV light curves, the orbital period would be twice the value given above, i.e. 6884 seconds or 114.7 minutes. This period also is present in the Lancelot output.
Phasing the data with the period of 6884 seconds results in the phase plot below:
Again, very low amplitude, but with what one may convince oneself is a definite double-humped sinusoidal appearance...
Now, what if one chooses a "random" period value? This was done (the value used being 5298.1 seconds), the process repeated, and the result is shown below:
There is, clearly, variation from one phase bin to another, but there is no clear cyclic trend across the phase axis from 0 to 1, although there is a general downward trend.
What if one does a period search on the time-series data for a field star of magnitude comparable to that of Lib 3? This was undertaken, and the result shown below:
The extent of the axes is the same as before (i.e. 0.8mag, two phase cycles). Again, there is a definite sinusoidal trend to the data, although with one phase bin at 0.05/1.05 being slightly out of place. As given by Lancelot, the corresponding period is 9560.7s, or 159.3 minutes, and the significance of this period in its periodogram was much greater than that for the period used for the Lib 3 data.
So- is the possible period for Lib 3, as derived earlier, real? Given the noise in the data, the low amplitude of any possible modulation in the Lib3 data, that there are only two nights of data, and that a presumably constant field star of similar magnitude and measurement errors shows a similar level of "modulation"- though at a different period- one would be hesitant to claim that Lib 3 is definitely variable as suggested above. More data, and especially more accurate data, are needed...
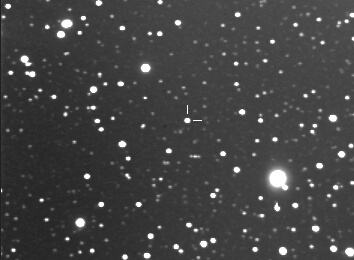
A co-added exposure of 376-mintues' total exposure. Lib 3 is between the tic marks near the centre. North is to the top, east to the left, and the field is about 13.4' high by 19.6' wide. Imperfect flat-fielding, accentuated by the co-addition process, is responsible for the gradient in sky brightness across the image.