Spectroscopy of Eta Carinae
Shown here are some results of using the LX200 and the Rainbow Optics diffraction grating to obtain spectra of Eta Carinae.
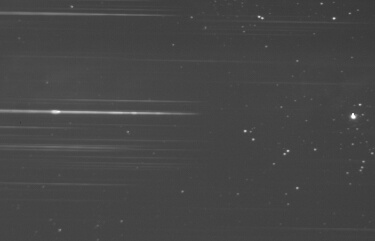
Full-frame ST-6 image (from 14-15/05/03). Zero-order image is to the right; first-order spectrum is to the left (l increases to the left). Eta Carinae is the brightest object in the field. Exposure was 10 seconds. Image has been log-scaled. The brightest portion of Eta Carinae's spectrum is the H-alpha emission line.
Calibrated and annotated spectrum based on the above spectral image. Note the "doubling" of the Ha line due to the spectrum being slightly out-of-focus.
For the above image, the telescope was focused on the zero-order image, and not on the spectrum (as is necessary for obtaining the best-quality spectrum). This does allow, however, easier identification of stars, etc, in the image.
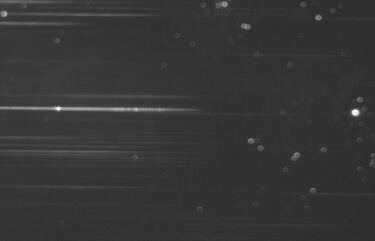
In this second image (from 26-27/05/03), the telescope was focused using emission lines in the spectrum. Therefore, the zero-order images are all out of focus. However, the features in the spectrum are now much sharper.
Trace of Eta Carinae's spectrum, based on data from 26-27/05/03. Vertical scale is arbitrary intensity; horizontal axis is pixel number.
![]()
Synthesised colour spectrogram, based on the reduced spectrum from 26-27/5/2003 (via VSpec) .
Comparison of spectra from 260503 (red) and 250603 (black). Wavelength and response calibration has been applied. Vertical scale is arbitrary intensity; horizontal axis is wavelength in Ångstroms. There is a slight discrepancy in the wavelength scale, especially at the short end, due to subtle variations in the calibration between the two nights. It is possible that the small changes in the Hb and Hg line intensities are real, but this is not definitely claimed at this time.
Dates for which spectra have been obtained : 14-15/5/2003; 15-16/5/2003; 21-22/05/02; 26-27/05/03; 27-28/05/03; 25-26/06/03