renderings of Mars and Venus
.........................................................................................................................................................................................
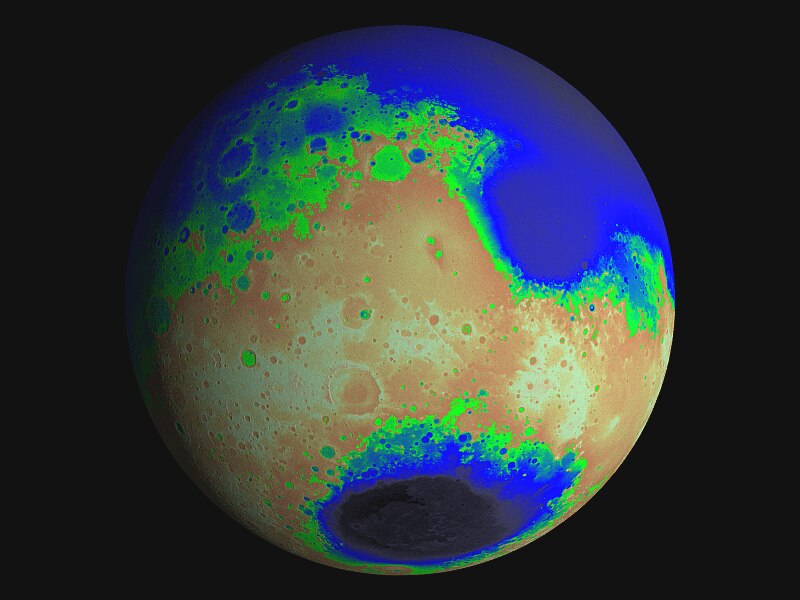
Mars : coloured elevations
These still images show false-colour elevations on Mars; cooler colours for low areas, warmer colours for higher. The range of elevations within each colour band is not constant, since we wish to be able to distinguish rapid changes in elevation, and this suggests that finer intervals are needed for regions in which this occurs. Extensive "flat" areas, such as are found in much of the northern hemisphere, do not require that much detail.
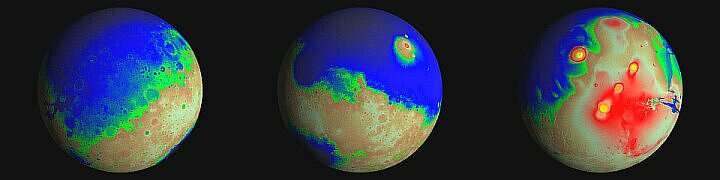
It will be moted that the blue-ish areas in these images correspond closely to the flooded areas represented in the terraforming pages. This is not surprising, since the low areas will be flooded first.
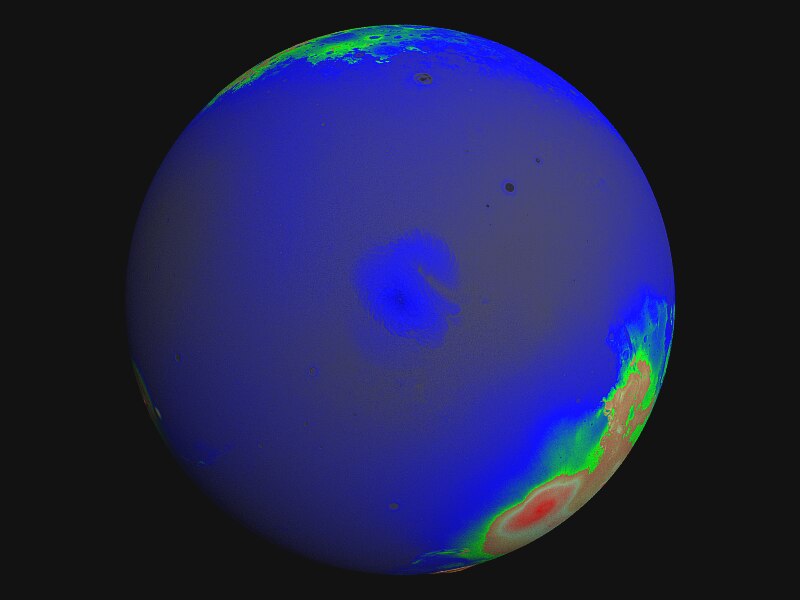
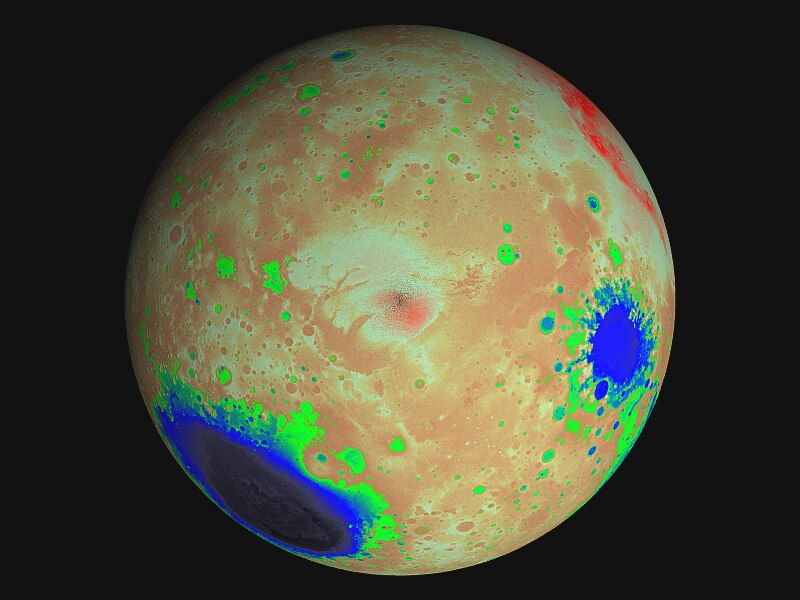
Top (left-to-right) equatorial views of : Hellas basin (73k) : Tharsis volcanoes (61k) : Valles Marineris (77k)
Bottom (left-to-right) polar views of : northern hemisphere (34k) : southern hemisphere (81k)
Several features are especially prominent in these renderings: the large and deep Hellas impact basin; the smaller Argyre basin; the Tharsis Bulge and its associated volcanoes; the long, deep cut of the Mariner valley. It may be said that some of the features to the north of the ends of Valles Marineris simply do look as though they are the result of large-scale liquid flows; one does not claim just from these images that was their cause, however.
There is a great disparity in elevations between the northern and southern hemispheres; there is very little elevated land mass in the north. I gather that the reason for this is still rather a matter of uncertainity. Note that the north polar ice cap is visible as a raised area; this is how the bump map used for these renderings represents that area.
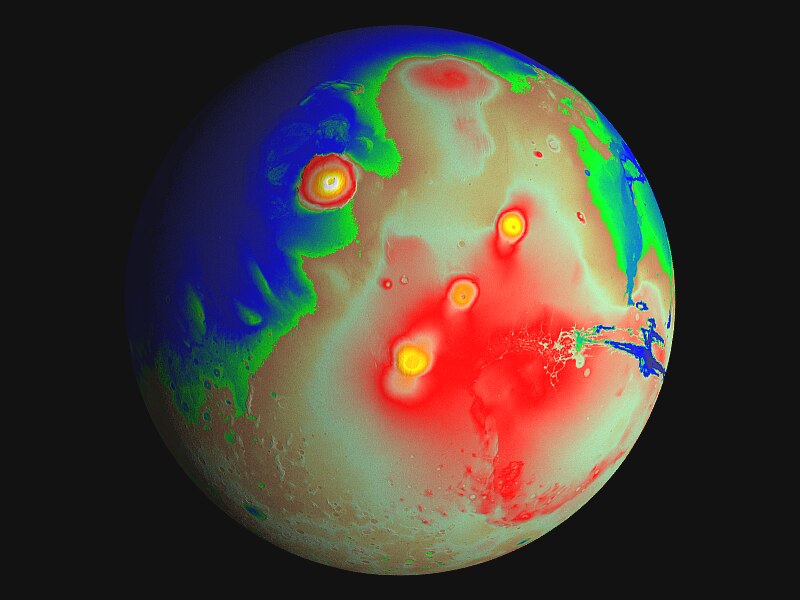
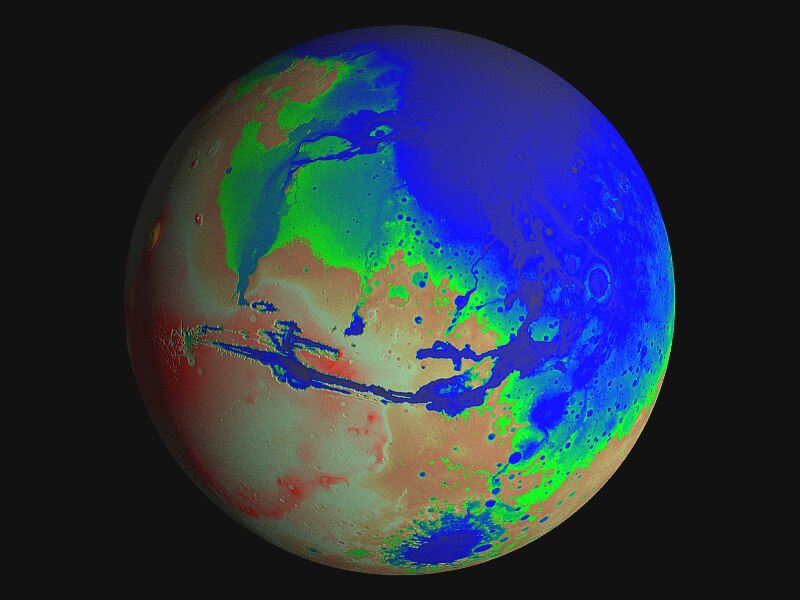
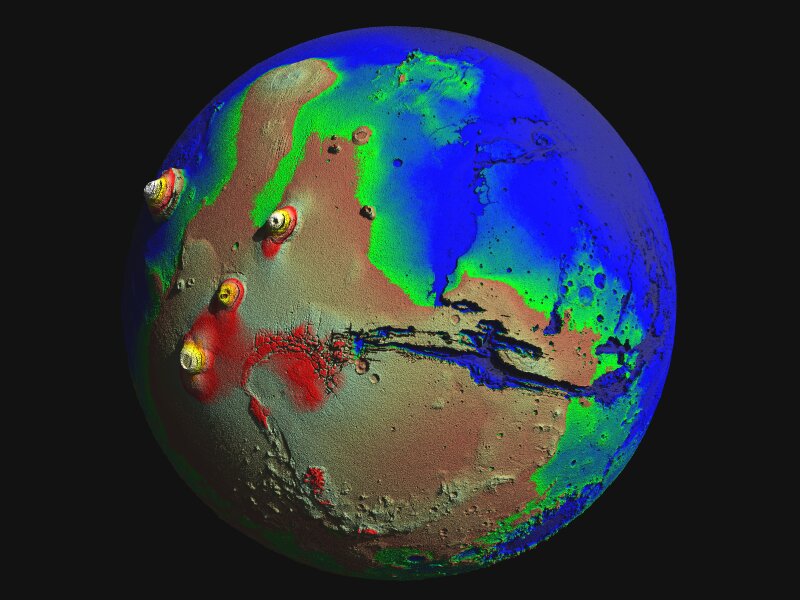
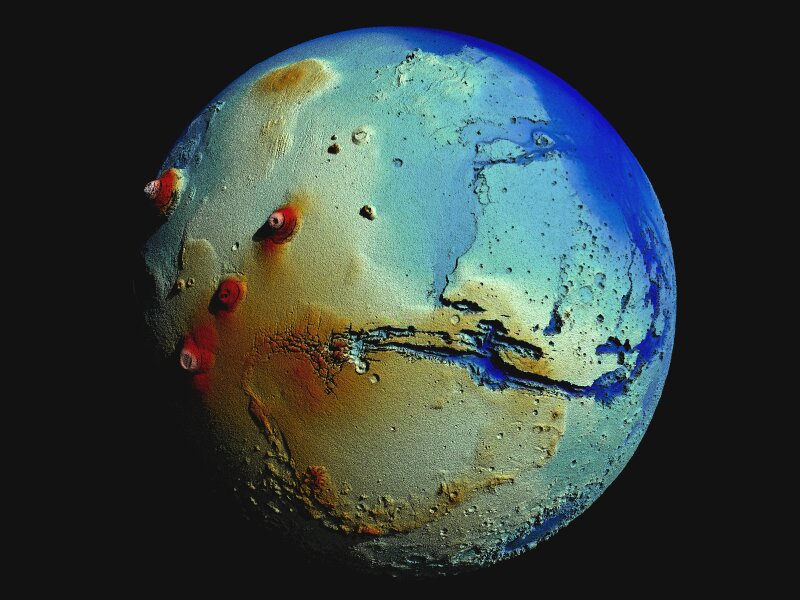
Another way to demonstrate variations in relief is to exaggerate the surface "bump" scale in the POV-Ray code. This will enlarge surface features relative to the overall object size. Some examples are shown below, along with colour-coded comparisons.
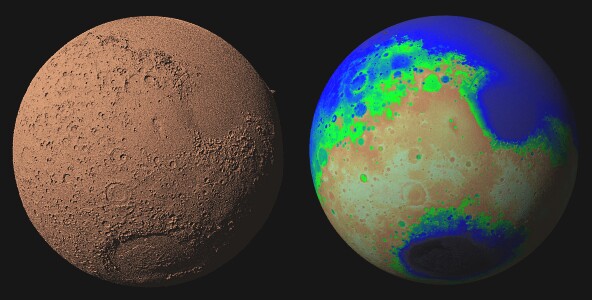
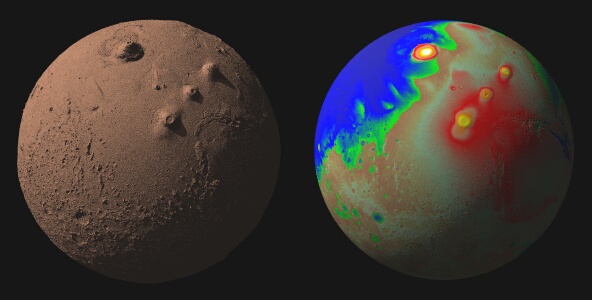
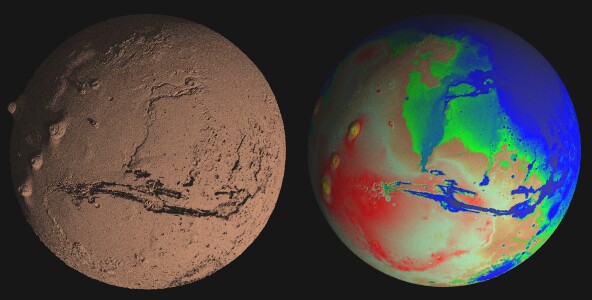
Of course, one may combine both methods as shown below: an exaggerated elevation scale with colour-coded elevations. Two ways of doing the latter are shown- on the left, a colour-map as used so far, and on the right, an image map, projected onto the surface, which is a false-colour version of the grey-scale height-field map used to produce the surface elevations.
.........................................................................................................................................................................................
Mars : coloured elevation animation
An animation based on a larger set of still images as explained above; one cycle of the animation shows all of the planet.
Due to the compression used to produce the AVI file, the image quality in the animation is much lower than that of the original image frames.
Mars : colour-coded elevations
.avi file (1,300k) marsalt2.avi ZIP file (1,082k) marsalt2.zip
A similar animation for Venus is being worked on.
.........................................................................................................................................................................................
Mars and Venus : view from Earth
The following animations show how the appearance of the discs of Mars and Venus changes during one synodic cycle with Earth; that is, over the course of time taken for either planet to return to some original location, relative to Earth, in its orbit. For Venus, this time is 583.92 days; for Mars, 779.94 days. (I'm not sure, though, if I've got all aspects of the Mars animation correct...)
Venus' equator is tipped only 2° from the plane of its orbit; for Mars, the value is 23.98°. For the Mars animation, a white line representing its equator has been included. Both planets have been rotated at the correct scale rates. In the POV-Ray code, the camera was set at the Earth's location (including its orbital motion), with the other planet moving in its orbit, and the camera following the planet.
In POV-Ray, the camera was, in essence, put at Earth's position in orbit around the sun (the origin, <0,0,0>), and was coded to look at the other body (Mars or Venus) as it also was in "orbit" around the sun. Rotational periods are scaled appropriately.
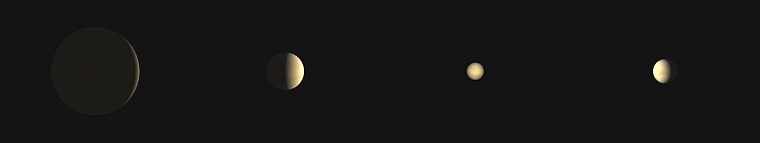
Venus phases : view from Earth, over one synodic cycle
.avi file (181k) venphase.avi ZIP file (118k) venphase.zip
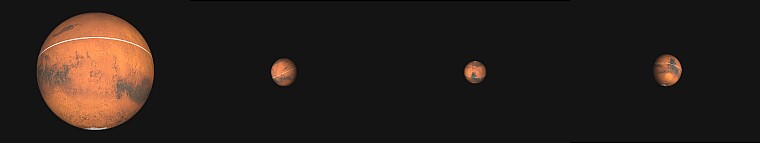
Mars phases : view from Earth, over one synodic cycle. Although Mars is a superior planet, it does indeed show phases- only gibbous through to total- never a crescent
.avi file (391k) marphase.avi ZIP file (334k) marphase.zip
.........................................................................................................................................................................................
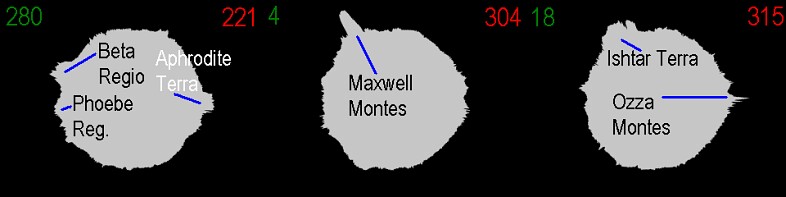
Mars and Venus cross-sections
The following two animations show cross-sections through the planets Mars and Venus. They were obtained by wrapping height-field images around a sphere (in POV-Ray 3.5), and then slicing across that sphere. Gross vertical exagerration has been applied in order to bring out the subtleties of variations in relief.
The full animations are 360 frames in length, i.e. one degree of longitude per frame. The animations run at 15 frames/second, or 24 seconds each. The images here show, for various frames, the locations of some of the more notable features of the planets' terrains. In all cases, the north pole is to the top of the frame, and the south pole to the bottom of the frame. To the left of the disc, in green, is the longitude that is crossed on the left-hand side of the disc. To the right of the disc, in red, is the frame number. These numbers are not included in the animations.
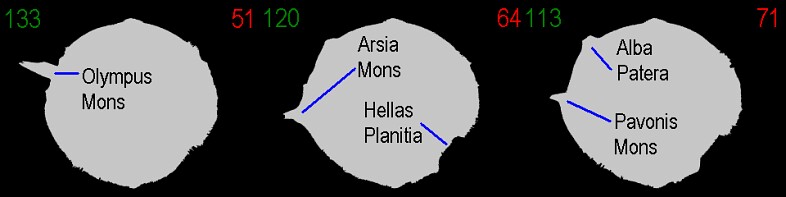
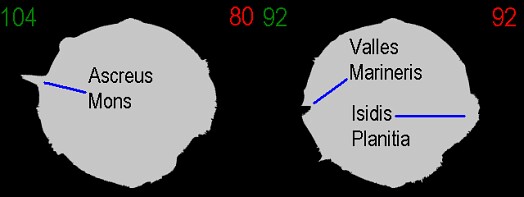
Above: notated cross-sections for Mars.
.avi file (732k) marxsec3.avi ZIP file (571k) marxsec3.zip
Below: annotated cross-sections for Venus.
.avi file (692k) venxsec3.avi ZIP file (539k) venxsec3.zip