SPARC Gravity Wave Initiative
Radiosonde Data Analysis
Introduction
The initiative is a cooperative effort between groups in a number of countries or regions. It builds on the work of Allen and Vincent who used high-resolution radiosonde observations in the Australian sector to study temporal and spatial variations of wave activity in the lower atmosphere. The aim is to produce climatologies of wave parameters in as global a scale as possible. Using wind and temperature data it is planned to produce climatologies of energy and of direction of propagation in both the horizontal and vertical directions. By studying the spatial and temporal variability in these parameters it should be possible to determine dominant sources, especially where the network is sufficiently dense, for example North America. Since some parameterization schemes are using spectral representations of the wave field the radiosonde data will also be used to better characterizing vertical wavenumber spectra in order to investigate the "universality" of spectral indices.
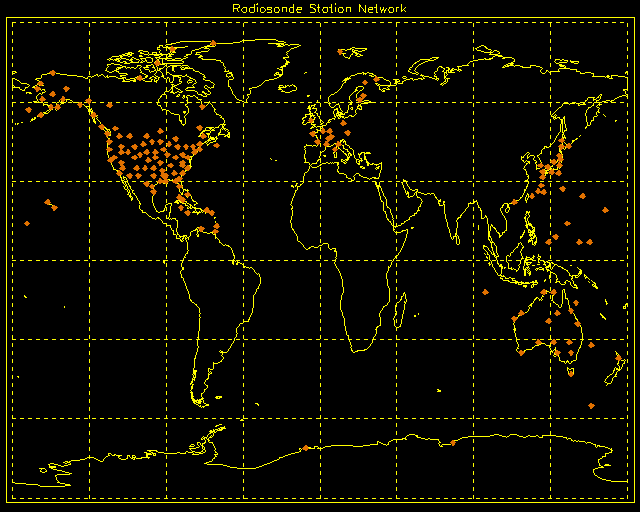
The following map shows the location of radiosonde stations that are being used in the project. Appendix A lists the location of the stations and the person(s) responsible for the analysis. Please check the list and advise me of any inaccuracies and/or updates.
Data Analysis
Reference is made to the following papers:
Allen and Vincent, J. Geophys. Res., 100, 1327-1350, 1995 (hereinafter AV95)
Vincent, Allen and Eckermann in "Gravity wave processes: Their parameterization in global climate models" (ed K. Hamilton) Springer-Verlag, 7-25, 1997 (ISBN 3-540-62036-2) (VAE97).
A package of IDL routines for carrying out the whole analysis procedure in as painless manner as possible is available (see below).
Radiosonde Analysis Files
IDL programs are made available for analysis of high-resolution radiosonde data. The programs were tested with IDL version 4, but should work with IDL 5. Please advise of any problems encountered.
Data Filtering Program: READ_SOND.PRO
This program reads data from radiosonde profiles. It is provided as an EXAMPLE only. Data from different locations will be provided in a different format. Use of the program is illustrated by using data provided by the Australian Bureau of Meteorology for its Cocos Islands station in the Indian Ocean (12°S, 97°E). It is assumed that the data are taken every 10 seconds (approximately 50-m height resolution), but the program can be adapted easily for profiles sampled at a different time resolution. The data are re-sampled to convert the observations to a 50-m height grid. A second-order polynomial is fitted to the data to give the mean wind and temperature profiles. The deviation from this fit gives the perturbation profiles.
Note, in the program provided only data between heights of 18 and 25 km are stored for later use. This height range was chosen because of the high tropical tropopause. The program will need to be modified to produce data in the 2-9 km range. The mean and perturbation profiles are stored in a data structure (called profile) for each year of observations, which is then written to disk as an IDL "SAVE" file.
The code provided assumes the radiosonde data for each launch are contained in separate file, which have the extension aed. Sample data for Cocos Islands from September to December 1992 are contained in a gzipped tar file. If you wish to test the programs with these data before you use them on your own data transfer the file (binary) and then unzip and extract them into your directory.
Data Analysis Program: MSPEC.PRO
This uses the IDL save files (eg Cocos96.sav) generated by the READ_SONDE.PRO and saved as a structure called profile, which has the form documented below.
|
Profile |
= |
{ascent, $ |
|
|
|
|
Date: 0.0D, $ |
; Date in Julian seconds |
|
|
|
Ub: fltarr(141), $ |
; Mean zonal wind |
|
|
|
Vb: fltarr(141), $ |
; Mean meridional wind |
|
|
|
Tb: fltarr(141), $ |
; Mean temperature |
|
|
|
Up: fltarr(141), $ |
; Zonal wind perturbation. |
|
|
|
Vp: fltarr(141), $ |
; Meridional wind perturbation. |
|
|
|
Tp: fltarr(141), $ |
; Temperature perturbation profile. |
|
|
|
Ut: 0.0 |
; Zonal wind at tropopause. |
|
|
|
Vt: 0.0 |
; Meridional wind at tropopause. |
For each calendar month the program:
|
Month |
Number of Profiles |
Eo |
m*(cpm) |
t |
ET |
Phi (deg E of N) |
Upward Fraction % |
|
1 |
23 |
27.9 |
2.1e-4 |
2.6 |
17.3(3.9) |
88 |
67 |
|
2 |
11 |
22.4 |
2.3e-4 |
2.7 |
15.7(4.2) |
70 |
68 |
|
3 |
30 |
19.6 |
2.1e-4 |
2.5 |
13.2(2.5) |
48 |
69 |
|
4 |
32 |
16.7 |
2.6e-4 |
2.6 |
11.0(2.2) |
139 |
69 |
|
5 |
32 |
17.9 |
2.7e-4 |
2.5 |
13.6(2.5) |
82 |
75 |
|
6 |
16 |
9.7 |
3.2e-4 |
2.4 |
8.2(1.7) |
49 |
65 |
|
7 |
28 |
10.6 |
2.3e-4 |
2.4 |
5.8(0.8) |
89 |
68 |
|
8 |
37 |
9.8 |
2.3e-4 |
2.4 |
8.7(1.3) |
73 |
74 |
|
9 |
37 |
9.7 |
2.5e-4 |
2.5 |
8.3(1.2) |
69 |
72 |
|
10 |
39 |
11.1 |
2.5e-4 |
2.5 |
11.8(1.9) |
53 |
79 |
|
11 |
43 |
12.3 |
2.8e-4 |
2.5 |
11.0(1.1) |
267 |
74 |
|
12 |
36 |
15.2 |
2.5e-4 |
2.5 |
13.3(1.2) |
79 |
78 |
SITE Dependent Variables are contained in MSPEC. INI
1. fspref: The string specifying the location and name for the data file.
Utility programs are contained in UTILITY.PRO
This package contains procedures and functions for computing date and time etc.
Examples of output (Cocos97.ps and Cocos97.log) and the programs themselves can be obtained from the anonymous ftp site by pointing your web browser to:
and saving the files.
Alternatively, do an anonymous ftp to bragg.physics.adelaide.edu.au
cd pub/atmos/rvincent
Retrieve files.
![]()
DISCLAIMER. There is no guarantee that the programs will work on your system. If you have any problems implementing the programs or find mistakes please not hesitate to contact me
.e-mail: rvincent@physics.adelaide.edu.au
Good luck!
Bob Vincent
Appendix A
The station coordinates are given in latitude (south negative) and longitude (west negative). Where available, the names and WMO station numbers are given.
Antarctica
Chet Gardner cgardner@uiuc.edu-90, 0 South Pole
Australian Stations
Bob Vincent rvincent@physics.adelaide.edu.au-35 139 Adelaide 94672
-35 118 Albany 94802
-23 134 Alice Springs 94326
-31 146 Cobar 96996
-12 131 Darwin 94120
-69 78 Davis 89571
-31 128 Forrest 94646
-24 151 Gladstone 94380
-12 137 Gove 94150
-43 147 Hobart 94975
-22 114 Learmonth 94302
-32 159 Lord Howe 94995
-20 139 Mount Isa 94332
-20 118 Port Hedland 94312
-19 147 Townsville 94292
-35 147 Wagga 94910
-16 150 Willis Is 94299
-31 137 Woomera 94659
-55 159 Macquarie Is 94998
-12 97 Cocos Is 96996
Canadian Stations
Jim Whiteway jjw@abber.ac.uk82.31 -62.18 Alert
80.00 -86. Eureka
74.72 -94.95 Resolute
50.68 -127.37 Port Hardy
43.56 -60.01 Sable Island
60.44 -135.04 Whitehorse
49.97 -119.38 Kelowna
58.83 -122.6 Fort Nelson
50.20 -70.05 Inukjuak
58.12 -68.42 Kuujjuak
69.06 -105.08 Cambridge Bay
l58.73 -94.07 Churchill
53.32 -114.06 Edmonton
60.02 -111.93 Fort Smith
60.47 -81.15 Hall Beach
58.45 -78.08 Iqaluit
76.14 -119.2 Mould Bay
47.34 -59.10 Port Aux Basques
53.88 -122.7 Prince george
65.17 -126.48 Norman Wells
50.13 -66.16 Sept Iles
63.4 -96.08 Baker Lake
64.12 -82.22 Coral Harbour
53.32 -60.43 Goose Bay
46.23 -75.56 Maniwaki
Finnish Stations
Rigel Kivi rigel.kivi@fmi.fi67.4 26.7 02836 Sodankyla
60.8 23.5 02963 Jokionen
62.4 25.7 02935 Jyvaskyla
French Stations
Claude Souprayen/Marie-Lise Chanin claude.souprayen@aerov.jussieu.fr42 9 07761 Ajaccio
48 -4 07110 Brest-Guipavas
44 4 07645 Nimes-Courbessac
45 -1 07510 Bordeaux
49 6 07180 Nancy-Essay
46 5 07481 Lyon-Satolas
49 2 07145 Trappes
German Stations
Werner Singer singer@iap-kborn.d400.de52 14 Lindenberg
-71 -8
79 12
Japanese Stations
Kaoru Sato sato@kugi.kyoto-u.ac.jp45.4 141.7 Wakkanai 47401
43.0 141.3 Sapporo 47412
43.3 145.6 Nemuro 47420
39.7 140.1 Akita 47582
38.3 140.9 Sendai 47590
37.4 136.9 Wajima 47604
36.1 140.1 Tateno 47646
33.1 139.8 Hachijoujima 47678
35.4 133.4 Yonago 47744
33.5 135.8 Shionomisaki 47778
33.6 130.4 Fukuoka 47807
31.6 130.6 Kagoshima 47827
28.4 129.6 Naze 47909
24.3 124.2 Ishigakijima 47918
26.2 127.7 Naha 47936
25.8 131.2 Minamidaitoujima47945
27.1 142.2 Chichijima 47971
24.3 154.0 Minamitorishima 47991
Hong Kong
Johnny C. L. Chan apjcchan@cityu.edu.hk22 114 Hong Kong
Italian Stations
Elisa Manzini manzini@dkrz.de44 11 Bologna
Korean Stations
Hye-Yeong Chun chy@atmos.yonsei.ac.kr36.0 129.38 Pohang 47138
New Zealand Stations
Bryan Lawrence b.lawrence@phys.canterbury.ac.nz-37 175 Auckland
Russian Stations
Alexandre Kats alexandrekats@mtu-net.ru68.6 33.1 Murmansk 22113
Switzerland/Austria
Christian Haeberli christian.haeberli@univie.ac.at46.8 7.0 Payerne 06610
48.3 16.4 Wien 11035
United Kingdom Stations
Lesley Gray Lesley.Gray@rl.ac.uk53 -5 Aberporth
US Stations
Marvin Geller mgeller@notes.cc.sunysb.edu43 -74
35 -107
35 -102
47 -101
37 -80
43 -116
26 -97
43 -78
47 -68
40 -89
33 -80
45 -93
42 -70
28 -98
29 -101
40 -105
37 -116
38 -100
41 -116
32 -106
35 -115
32 -97
39 -108
44 -70
47 -111
44 -88
36 -80
49 -93
32 -90
31 -82
24 -82
30 -93
34 -92
42 -123
23 -80
36 -87
35 -77
35 -97
41 -101
38 -122
33 -85
40 -80
42 -91
48 -124
44 -103
39 -120
43 -108
45 -123
41 -112
33 -117
19 -66
46 -84
32 -91
30 -90
47 -117
37 -93
39 -77
30 -84
28 -82
39 -96
32 -111
41 -73
41 -96
39 -84
43 -83
61 -150
55 -132
71 -156
61 -162
55 -163
65 -148
58 -157
58 -153
67 -163
63 -156
65 -165
57 -170
59 -140
14 145
20 -155
7 134
22 -159
14 -171
7 158
7 152
19 167
9 138
12 -69 Curacao
18 -77 Kingston
25 -77 Bahamas
18 -63 St Marten
11 -61 Trinidad
13 -60 Barbados
20 -81 Grand Cayman